Introduction
SParTA - Surgical Parameters for Training and Assessment
This is a microsurgical suture task assessment system that can be used for formal assessment and for self-practice. It does not require an expert assessor, and objective feedback and scores for a sutured strip can be provided by quick analysis of an image of the strip.
Obtaining a good photograph
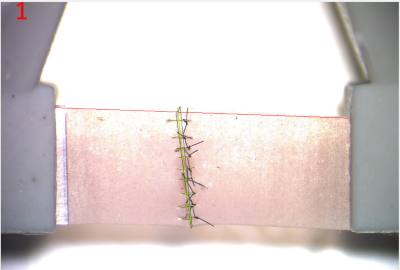
A clear photograph of the sutured task is necessary for proper assessment. We recommend taking the photograph through the eye-piece of the microscope or using a dedicated microscope camera if possible.
A final resolution of about 70 pixels per millimeter is sufficient. Please see the included sample image for an appropriate image for analysis.
User Interface
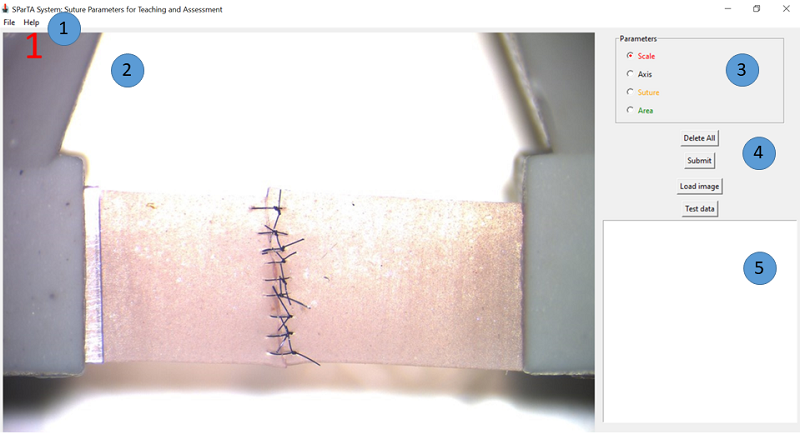
- File menu
- Image analysis area
- Parameter assessment options
- Choice radiobuttons
- Delete all: Deletes all the parameters marked, the loaded image, and clears output area
- Submit: Submits marked parameters for scoring
- Load image: Loads a test image for assessment and scoring
- Test data: Loads test data for scoring
- Output area
Assessing a strip
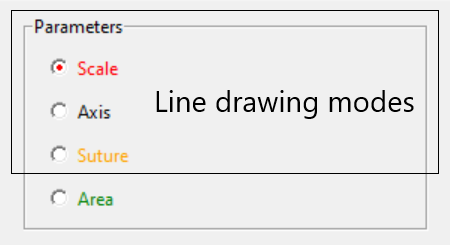
It is recommended that you assess a microsurgical sutured strip in the order given by the radiobuttons:
- Scale: This is automatically chosen when the program starts. There should be only 1 scale line. When the scale line is marked, a popup dialog box wil prompt you to enter the length of the reference line.
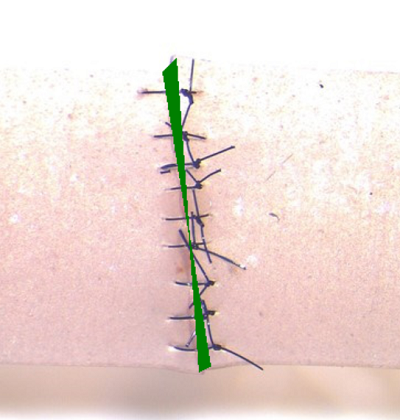
- Axis: This line marks where the sutures should run across. There should be only 1 axis line.
- Suture: Each line marks the start and end of each suture. The scoring system expects 9 sutures. Sutures less than 9 will receive penalties in the score.
- Area: Mark the 4 points of an irregular polygon for the overlapping areas of the suture line. The system will measure the amount of overlap.
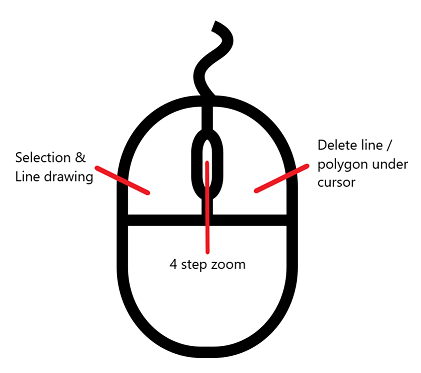
Drawing lines in Scale/ Axis/ Suture mode
- Ensure you are in the right mode by choosing the correct radiobutton.
- Move mouse to start of the point you want to select for start of the line
- Left click the mouse to mark it
- Move the mouse to the end of the line. A trailing line from the curent mouse position to the start of the line is seen.
- Click on the point to end the line. This will finalize the line you want.
- To start again, you can delete the line by right clicking the mouse. Alternatively, for the scale and axis line, if you draw a second line, the previous scale/axis line will be deleted.
- There is no autodelete for suture lines. The program will allow you draw an unlimited number of lines.
- There is a four step zoom in function which is activated using the scroll mouse. When this function is activated, you will see a zoom window appear centered around the current mouse position. When you draw the line, you will see a similar trailing line, but this line will be the actual line and not appear zoomed.
Drawing the irregular 4 point polygon for area calculation
- Ensure you are in the area mode by clicking the radiobutton or choosing Alt-a.
- Move to the first point and left-click the mouse to select it. If you hold the mouse key down, you will see a blue dot marking the spot.
- Move to the second, third and fourth point to mark them as per (2). When the fourth point is clicked, the polygon will be drawn on screen.
- There is no need to return to the first point.
- Ensure the lines do not cross, otherwise the area calculation will be inaccurate.
Pitfalls to be aware of when picking the polygon points
Toggle visibility of marked parameters
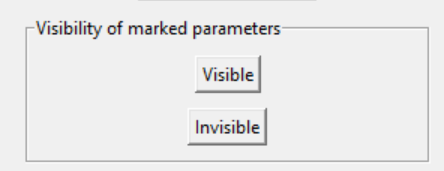
You can use the visible/invisible buttons above to view and hide the marked parameters. Any new parameters drawn after making the existing parameters invisible will be visible. This function is helpful to declutter the strip while you are marking it up.
Keyboard shortcuts
The mouse is the easiest way to use the application.
However, for faster navigation of the system, keyboard shortcuts are provided. These are:
- Ctrl-f: Choose file
- Ctrl-s: Save data
- Ctrl-q: Quit program
- Ctrl-w: Combined save json file and report
- Ctrl-Shift-d: Delete all
- Ctrl-Shift-s: Submit for scoring
- Ctrl-c and Ctrl-v for cutting and pasting results from the output area.
You can also access the main menus using the keyboard as follows:
- Alt-f: File menu
- Alt-e: Edit menu
- Alt-a: About menu
After opening the respective menus, the items in the menu can be invoked by using their respective underlined keys.
Radiobutton selection
You can cycle through the radiobuttons and buttons below them using the tab key. Select the radiobutton or button you want by pressing the bar or clicking with a mouse. In addition, there are keyboard shortcut keys for the radiobuttons:
- Alt-s: Scale
- Alt-x: Axis
- Alt-z: Suture
- Alt-a: Area
Results output area
After the parameters are selected as shown above, click the submit button (or press Ctrl-u) to calculate the score.
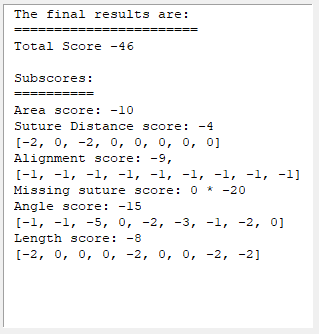
The score for the strip based on the parameters will be displayed in the output area as shown above.
The most important score is the total score. It is -46 in the example above.
The total score is a summation of the subscores, which are shown below the total score
- Area score: area of overlap of the sutures
- Suture Distance score: consistency of spacing between sutures
- Alignment score: relative alignment of the suture
- Missing suture score: -20 for each missing suture
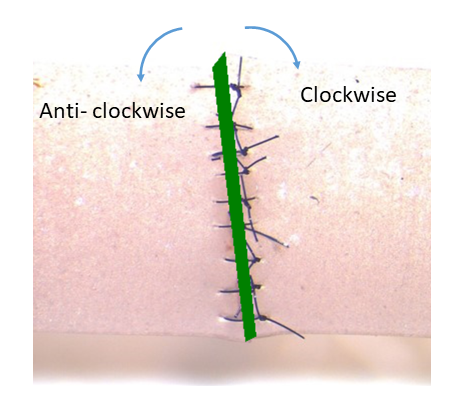
- Angle score: summation of the each suture’s orientation with the strip
- Length score: consistency of each suture
Exporting and Saving Data
Exporting data
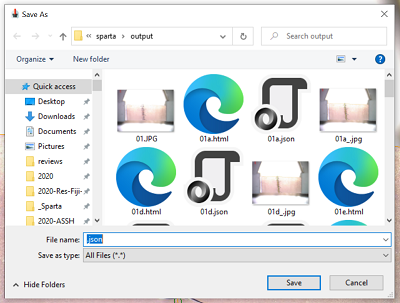
After score submission and display, the score can be exported using the File->Save Data menu choice. This save file dialog will open to prompt you provide a filename for the saved data. The software saves the data in the .json format. It is human readable using any text editor.
Creating a report
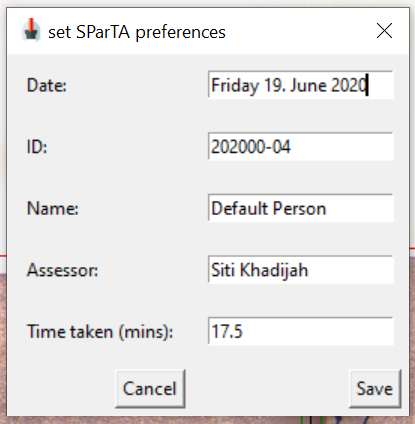
You can create a report after you pick the points, and submit the results. You can select some output information by entering it in the preferences window. You can access the window via Edit->Preference. This will display the preferences window as shown below:
Save both data and report
You can export the data (as a json file) and save a score report with a single commmand, using File>‘Save World’_ menu choice. It will open two consecutive save file dialog boxes (json export followed by report) for you to save the respective files. Each dialog box is set to the correct extension (i.e. ‘.json’ and ‘.html’) as default, so only the basename (i.e. “file01” instead of “file01.jpg”) is needed. However, it will also accept a filename with extension.
Loading previously saved results
Data exported in .json format can be reloaded using the File->Load results menu choice. This file open dialog will allow you to select a valid results file and load the original image together with the saved parameters of the image. You can then edit the parameters as usual and then rescore it. Correct loading depends on the image file being in the same location as the exported json file.
About and Changelog
Sparta is both the name of the software you are using and the assessment system that does the assessment of the strip.
SParTA Software Version 0.5 Copyright Alphonsus Chong 2020-05-13
Version 0.6 2020-07-25
- 0.5 entered internal production use on 2020-07-21
- bug fix: json file saves only filename and not full path. loading json file now searches in same directory as json file for the image
- changed naming convention of score image to ’*_.jpg’
- add command in menu to export json and save report
- added hyperlink to spartascore.net in report template
- updated help file to reflect these changes
Older versions
- version 0.5 2020-07-11
- added load from exported json file
- added toggle visibility of marked parameters
- removed buttons to load test image and parameters
- version 0.1 2020-05-13
- version 0.2 2020-05-31
- version 0.3 2020-06-19
- version 0.4 2020-06-28
Software and this manual are Copyright 2020 Alphonsus Chong.